

Pulse of Tri-City travel and tourism industry beats strong

By D. Patrick Jones
Nearly all
communities want to be popular with visitors. The sentiment has sound economics
behind it since visitors bring new dollars into the local economy. Their visits
catalyze economic transactions that wouldn’t have happened otherwise. There
are, of course, other, non-monetary reasons to embrace visitors, such as
introducing the outside world to the place we call home.
But measuring the
effects of visitors is complicated. Ideally, we would like to know how big a
contribution they make to the local economy. And whether their economic
influence is growing or diminishing. A problem: there are no turnstiles at
county lines asking for visitor status.
To begin, what do
mean by tourism? Following federal standards, the official term is “travel and
tourism.” This definition covers visitors for both business and leisure
reasons. The sectors typically included in travel and tourism are, ranked by
size nationally: non-air transportation, accommodations, air travel, shopping,
food and beverage services, and recreation and entertainment.
Thanks to the U.S.
Department of Commerce, we have a sense of the size of travel and tourism at
the national level. Its measurement is relatively new since these activities
have never been recognized as a unique sector, such as manufacturing or
agriculture. Instead, for the past 20 years the commerce department has
produced a satellite account. This approach pulls effects such as spending or employment
from the regular sectors of our economic accounting via assumptions about what
constitutes resident or visitor activity. What’s a visitor? According to the
feds, someone from 50 or more miles away. As a satellite calculation, the
totals are not used in producing national aggregates such as GDP.
For 2016, the most
recently analyzed year, the Department of Commerce calculated that 3.6 percent
of the U.S. workforce was engaged in travel and tourism. Further, 2.8 percent
of the national GDP was accounted for by visitor spending. These are direct
effects, and do not include the impact of any multiplier calculations.
How much do visitors
spend in Benton and Franklin counties? Nothing is available from the commerce
department for states, metro areas and counties. If we applied national ratios
to the Benton-Franklin metro economy, we’d arrive at nearly $330 million in
“visitor GDP” in 2016 — or about 5,200 jobs, full- or part-time. But that
assumes that travel and tourism in the two counties mirrors national averages.
What is the true effect annually? The short answer is, we don’t know with great
accuracy.
Benton-Franklin
Trends data, however, contains at least two indicators that point to the size
and growth of travel and tourism. The first comes from a Portland research
organization, Dean Runyan & Associates. Much like the Department of Commerce does nationally,
this firm analyzes the visitor economy at the state and local levels. The
methodology, while complicated, is similar to that of the feds.
At the core is an
estimate of visitor spending. Spending has two elements: the volume of visitors
and spending per visitor. Both components are not easy to estimate, with
spending per visitor dependent on a set of surveys that are then applied
broadly. Visitor count estimates largely follow from hotel/motel occupancy
reports, although the growing popularity of private rental homes has
complicated those calculations. Once visitor spending is estimated by sector,
other direct effects, such as employment, can be calculated.
What
does the Trends indicator on direct visitor spending reveal about travel and
tourism in the two counties? For the most recently estimated year, 2017, total
expenditures summed to nearly $625 million. That represents more than a
doubling since 2000. In terms of a growth rate, expenditures have climbed 4.8
percent, compounded annually. This contrasts to a 2.7 percent growth rate
throughout Washington state for nearly the same period, 2000-16.
What
does the lodging tax tell us?
A
less ambitious but accurate measure of travel and tourism can be found in state
taxes levied on the accommodations industry. By definition, the bulk of
activity of hotels is putting “heads in beds.” And it’s unlikely that many of
those heads are local ones. Some of the state collection is returned to the
communities for visitor promotion.
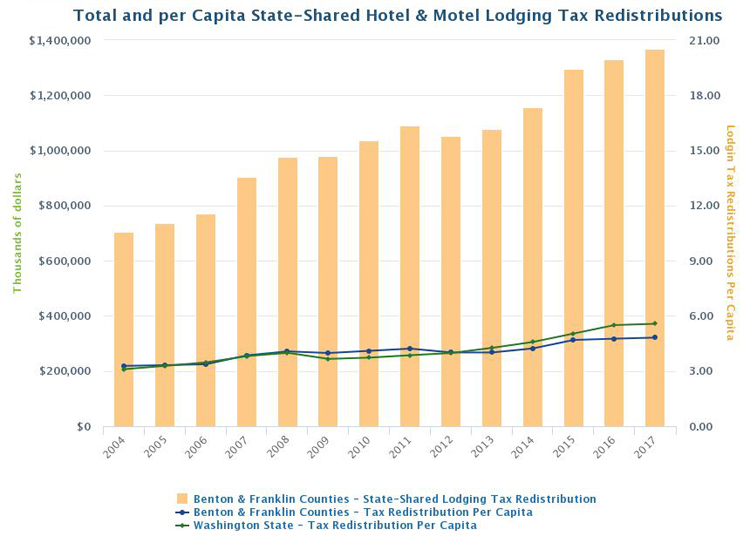
The
Trends indicator on lodging tax redistributions tracks spending at hotels and
motels, using the “state shared” rate (the general sales tax rate). This
component of redistributed lodging taxes is based on a largely a constant rate,
enabling year-to-year comparisons within the accommodation sector. This
approach also enables comparisons to other counties in the state because their
general sales tax rates do not vary much either. Many communities levy
additional taxes on visitors, but this measure excludes them.
What
does the lodging tax redistribution indicator tell us about the growth of
accommodation revenue in the greater Tri-Cities? Strong growth over the
interval, 2004-17: 5.2 percent per year compounded annually. The reflects a
near doubling of accommodation revenues in the past 14 years. The graph shows
the experience of the accommodation industry in all of Washington to be about
the same, with a compounded growth rate at 5.8 percent.
Despite
the difficulties in measurement, it certainly appears that the greater
Tri-Cities is showing a strong pulse in travel and tourism.
D. Patrick Jones is executive director
for Eastern Washington University’s Institute for Public Policy & Economic
Analysis.