

Diversity vibrant in Tri-City population but not so much in economy
By D. Patrick Jones
Diversity comes in many dimensions — gender, sexual preference, racial/ethnic makeup, to name a few. This column takes up one — racial and ethnic diversity — in part because it tells such an interesting story for the two counties.
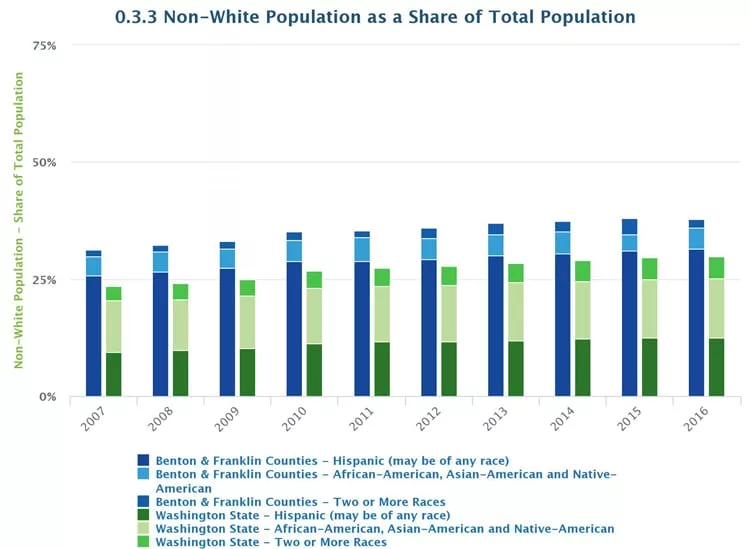
First, let’s state the obvious: Benton and Franklin counties show unique racial and ethnic diversity. And the community continues to become more diverse. The indicator tracking the share of the non-white population on the Benton Franklin Trends indicator website makes this quite clear.
 (Courtesy Benton-Franklin Trends)
For 2016, the U.S. Census estimated that about 38 percent of the population consisted of people of color. That share is up from 31 percent a decade ago. As the graph illustrates, this makes the Tri-City area stand out from Washington state, which sported a considerably lower share over the decade. Among Eastern Washington metro areas, only Yakima County shows a higher level of diversity, although Grant County, a non-metro area, has a higher one as well.
An implication? If the past decade’s growth rate of the non-white population continues, the two counties will be majority-minority within a dozen years, joining Yakima County. Another implication: local businesses will need to continue to modify their assortment of goods and services to ensure it resonates with local consumers.
Of course, there is already a majority-minority part of the area – Franklin County, and, in particular, Pasco. One can see this by “drilling down” in the Trends’ online graph by clicking the buttons for county or city. This outcome has held for a decade, unique to Washington state.
To the surprise of few, racial and ethnic diversity is not evenly distributed in the greater Tri-City area. Surprising, however, might be how wide the gaps are.
While Franklin County could point to an estimated share of residents of color of nearly 60 percent in 2016, the similar estimate for Benton County was less than half, at 28 percent. The contrast between the cities is even starker: Pasco’s share of minority residents in the total population was 61 percent, while the same share in Richland was about 20 percent. Kennewick’s estimated share lay in the middle.
To continue to state the obvious but to put some numbers on it, Latinos are responsible for the high mix. Within the two counties, they make up more than 31 percent of the total population. Racial minorities (African-Americans, Asian-Americans, Hawaii-Pacific Islanders and Native Americans) made up only 4.5 percent of the area population in 2016. People of “two or more races” make up the remainder.
How has the business sector incorporated this evolution? One measure is business ownership. The census tracks minority business ownership once every five years, with 2012 representing the most recent count. (The 2017 data will be out in a few months.) Compared to the prior census (2007), business ownership by minorities jumped to 19 percent, up from 15 percent. While that is progress, a substantial gap between minority business ownership and its population obviously still exists.
The gap raises the question of why? What are the barriers that might be in the way of business formation and success by businesspeople of color in the area? Are there tools, mentors and paths readily known to them to help them succeed?
Another key to economic success is the work force. One measure of work force is earnings. How have earnings reflected the demography of workplace? The census provides annual estimates of earnings by race/ethnicity for the two counties.
While wages for the work force of color have gone up during the past decade, to what degree have those gains matched stride with the white work force? A ratio of the average earnings of the key minority to those of the entire work force offers an illustration. In 2013, male Latino workers earned 56 percent of the area average; by 2016, that ratio had climbed to 60 percent. So, we can point to some improvement for Latinos, at least males. For Latinas, the ratio essentially stayed the same.
Why do Latinos, on average, earn so much less than their white counterparts? Undoubtedly, the reason lies in the type of jobs typically taken by them.
Over time, it will be insightful to track the earnings ratio, because if it rises, it will largely mean that Latinos have migrated from the current mix to higher paying jobs. (Of course, it also might mean that local agriculture is increasing wages faster than the overall average.)
There are many more implications of a rising share of Latinos in the greater Tri-Cities that can’t be covered in this column. The move to a majority-minority population and with it, economy, seems indisputable for now. Consider the latest from the K-12 education system. As of fall 2017, 53 percent of the children in area public schools were kids of color, up from 47 percent a few years before.
The success of the greater Tri-Cities adapting to this reality will determine many economic outcomes – productivity, earnings, income, taxes, and, ultimately, quality of life.
Patrick Jones is executive director for Eastern Washington University’s Institute for Public Policy & Economic Analysis. Benton-Franklin Trends, the institute’s project, uses local, state and federal data to measure the economic, educational and civic life of Benton and Franklin counties.