

Tri-City students step one foot forward, one foot back
By one key measure, public schools in Benton and Franklin counties have shown strong progress. By another, students in the counties’ public schools are not succeeding.
The positive conclusion stems from high school graduation rates, or specifically for this column, the five-year high school graduation rate.
Benton-Franklin Trends data reveals steady progress in raising the percentage to the most recent value, those graduating in 2020, of 85.5%.
Consider that a decade ago, the average rate for the public districts in the two counties stood at 74.1%. At that time, local districts lagged the state rate by nearly five percentage points. Now, the local average exceeds the state rate by 1.5 percentage points.
Graduation rates are measured on a cohort basis, defined as those entering ninth grade.
The denominator of the rate, the student count, stays the same through the high school years, except for transfers out and in.
The number of students who graduate in four years, expressed over the cohort number in the fourth year, determines the on-time graduation rate. In turn, the number of students who graduate in five years, expressed over the cohort number in the fourth year, yields the five-year, or extended, graduation rate.
Due to the large number of students in the two counties who start school as English language learners, a five-year rate seems the more appropriate measure.
It gives, in particular, these students a chance to catch up. In fact, the extra year has recently allowed for that graduation rate to climb by a few percentage points over the four-year rate for the combined counties. For example, compare the 2018-19 four-year graduation rate with the 2019-20 five-year rate.

There are undoubtedly many reasons for this welcome improvement among public high school students. Some might be: schools paying greater attention to unexcused absences, a greater awareness among students and parents of the importance of finishing high school, early intervention with students showing poor academic performance, and greater flexibility by schools in finding alternatives to the traditional graduation path.
Like most averages, these rates mask significant variation among the districts.
For example, the most recent five-year rates for the three largest school districts – Kennewick, Pasco and Richland – were 82%, 83% and 90%. Of the three districts, Pasco has demonstrated the most gains, moving from a five-year rate of 69% for those who graduated in 2011 to an 83% rate to those who graduated in 2020. All districts have shown improvement.
And yet many occupations require training beyond high school skills. Some of these skills may be acquired on the on the job. But most will involve a more formal approach, one found at a technical school, community college or a four-year higher education institution.
By this measure, Trends data shows not too many local students are acquiring the necessary skills. The indicator tracks the share of high school seniors who attend a higher educational institution within one year after graduation.
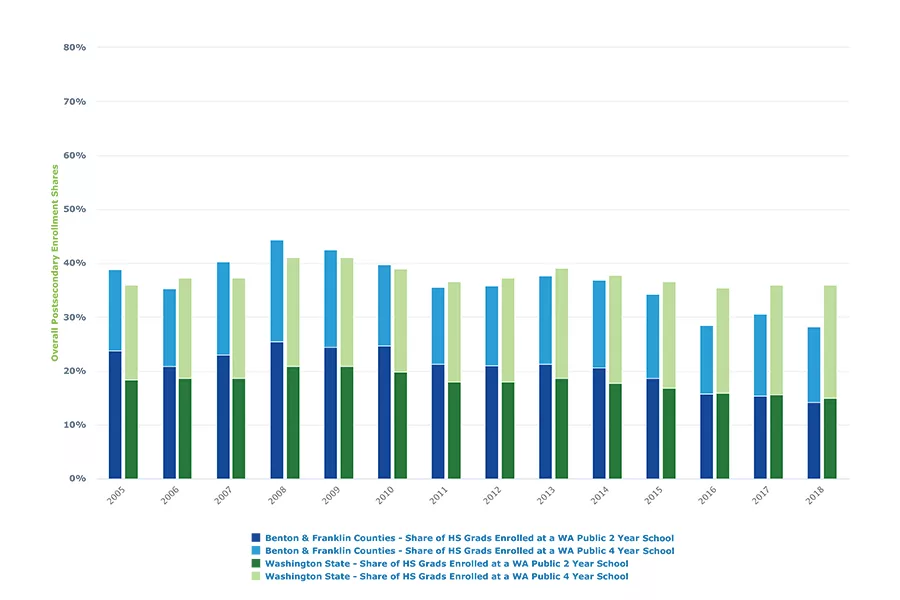
The graph displays two types of higher educational institutions: two- and four-year. The counts (and shares) include in- and out-of-state institutions. Private institutions are part of the mix. The latest graduating class is from 2018, as data compilation from higher educational institutions takes quite a bit of time.
It is easy to see that in recent years the share of public high school students who attend some form of post-secondary training and education has declined over time.
For the class of 2018, about 14% went on to a community or technical college while another 14% went on to a four-year institution.
Compared to the classes covered early in the graph, the share of high school grads who attended a two-year has shrunk considerably – from 23.7% in 2005, to 14.2% in 2018. The share of high school grads going on to a four-year higher educational institution has declined by about one percentage point.
The current rate among local community and technical college students closely matches the statewide experience. As the graph shows, it wasn’t always so. In 2005, the share of local public high school students who continued their education at a two-year higher educational institution was much higher, about 24%.
The more perplexing current comparison with Washington lies with students attending a four-year institution. That share is now seven percentage points lower than the statewide average. Over the same time period, the average of state public-school students who have continued their education at a four-year institution has increased by over 3 percentage points. Yet, the share here has declined.
Without a survey, it is difficult to say why this has happened. It is this columnist’s hunch that both family expectations and finances loom large.
Whatever the reasons, these and other barriers must be overcome. The Tri-Cities’ economy of the future will demand a workforce with at least some exposure to community college or technical schools that is greater than 14%. And it will demand more bachelor’s degree-qualified jobs than the current 14% share of high school grads seeking that degree.
D. Patrick Jones is the executive director for Eastern Washington University’s Institute for Public Policy & Economic Analysis. Benton-Franklin Trends, the institute’s project, uses local, state and federal data to measure the local economic, educational and civic life of Benton and Franklin counties.