

Pandemic deals different economic hands to the Tri-City workforce

Recently, the Eastern Washington University’s Institute for Public Policy & Economic Analysis was asked by the Port of Kennewick to conduct an “environmental scan” of the economy of the greater Tri-Cities. The overriding goal was to determine the impact of the pandemic on a variety of economic dimensions. One of these was equity.
Due to efforts of national and state statistical agencies, we can actually provide some answers. But first, let’s start with the lay of the economic land, pre-pandemic. A summary measure, median household income (MHI), gives us a good reading. While not available by race and ethnicity in the two counties on an annual basis, MHI is available as a five-year rolling average, thanks to the U.S. Census. The pre-pandemic period of interest is then 2015-19.
What do the estimates tell us for this period? In two words, huge gaps. For the five-year period, overall median household income was a little more than $67,000. For non-Hispanic whites, MHI was nearly $82,000; for Asian-Americans, nearly $89,000. The MHI for Hispanics/Latinos was $48,000, and for Blacks, it was $24,000.
Admittedly, the estimates suffer a bit of accuracy due to the small numbers of Blacks and Asian-Americans in the general population. The margins of error for the estimates were wide, at +/- $12,224 and +/- $15,621, respectively. But even if we adopt the upper limit of the MHI estimates for Blacks and the lower limit for Asian-Americans, the result is still a yawning gap.
Since these data are available only on a five-year rolling year basis, we really won’t be able to pinpoint the effect of pandemic year 2020. There are a couple other measures, touched on in the Port of Kennewick study, however, that allow some conclusions.
First is earnings. Census reports average monthly on a quarterly basis by county by race and ethnicity, among other characteristics. (The data product is Quarterly Workforce Indicators, or QWI.) In its study, the institute looked at the path of monthly earnings from the start of 2019 through the first quarter of last year, the most recent quarter available. The results both reinforce and counter the household income distribution.
Reinforcing the distribution of MHI are earnings by Asian-Americans. At the start of 2019, they were $4,801. Their cumulative growth rate over the 11 quarters was also the highest, increasing by 39%. Non-Hispanic whites started the period with the highest monthly wage, at $4,492. Yet, their rate of increase was the lowest, at 8%.
In between were other racial groups, showing cumulative increases in wages in tight ranges of 11%-13%. These are hardly the kind of increases that will move incomes of these racial and ethnic groups close to the overall median.
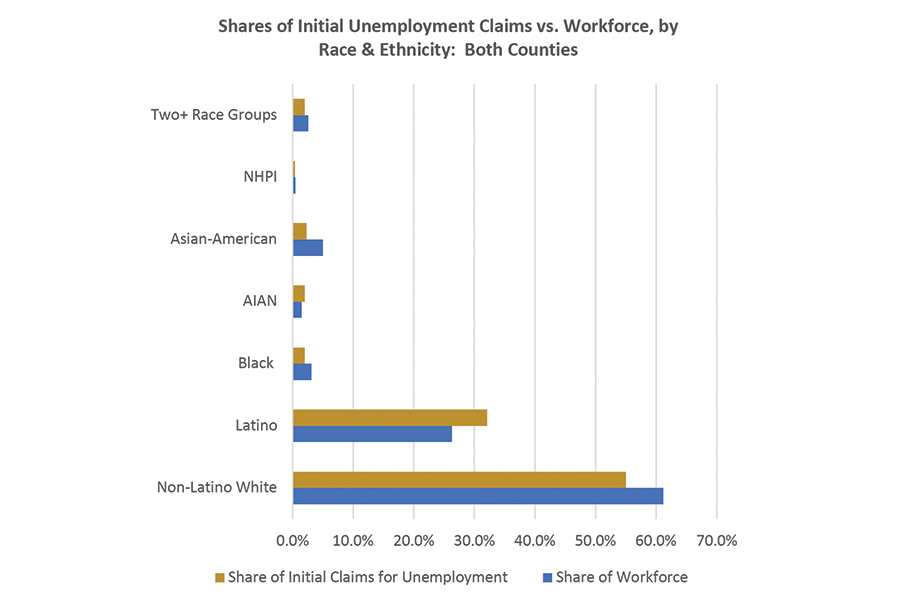
Another economic metric available by race and ethnicity stems from Washington Employment Security Department’s (ESD) Covid-19 tracking efforts. The agency has issued data on initial claims for unemployment insurance by race and ethnicity since the start of the pandemic. The number of claims can be converted into cumulative shares by race and ethnicity through the end of last year. These shares can then be juxtaposed against the average make-up of the greater Tri-Cities’ workforce by race and ethnicity over the same period, available from QWI.
The results? Asian-Americans, though a small component of the workforce, showed a much smaller share of initial claims for unemployment insurance relative to their share of the workforce. On the other hand, Latinos made up nearly a third of the initial claims. Yet their average share of the workforce was 26%. And non-Hispanic whites? They made up 55% of the cumulative claims, yet their average size of the workforce was 61%.
The result for Blacks was actually similar, albeit at a much smaller scale. They made up, on average, 3.5% of the workforce, yet cumulatively about 2% of initial claims for unemployment.
Clearly, by this measure, the Hispanic/Latino workforce endured a much harder knock from the pandemic than other groups. This likely reflects the high percentage of this group in customer-facing industries, such as lodging, restaurants and retail. It also reflects the challenges faced by agricultural firms, as Covid-19 hit its workforce hard. By mid-year 2021, agricultural headcount was still below pre-pandemic levels.
All in all, one group, Asian-Americans, posted substantial gains during the pandemic, after starting in an already high position. The largest segment of people of color in the workforce, Hispanics, gained modestly in average earnings, but lost ground in employment. Non-Hispanic whites, still the overall dominant group in the greater Tri-Cities, did not gain much in earnings but avoided disproportionate employment losses.
Just as the pandemic treated various sectors differently, so it did to the workforce of the greater Tri-Cities.
D. Patrick Jones is the executive director for Eastern Washington University’s Institute for Public Policy & Economic Analysis. Benton-Franklin Trends, the institute’s project, uses local, state and federal data to measure the local economic, educational and civic life of Benton and Franklin counties.